



Many expected that 2026 would be a year of some normalcy for freight markets after suffering through several years of a “freight recession.” However, war, tighter capacity, and shifting tariff policies have helped to prolong the uncertainty that the freight industry has experienced for quite some time now. Gaining a better understanding of current freight markets is why DC Velocity is partnering with U.S. Bank each quarter to present the “U.S. Bank Freight Payment Index Report.”
U.S. Bank is a provider of freight audit and payment services that processes more than $46 billion in freight bills annually. In addition to acting as a financial intermediary, the company offers data analytics through the U.S. Bank Freight Payment Index, which measures quantitative changes in freight shipments and spend activity based on data from transactions processed through the U.S. Bank Freight Payment platform. The report generated provides a quick snapshot into the freight industry, including breakouts of trends throughout America’s regional markets.
The following is a condensed version of the “Q2 2026 U.S. Bank Freight Payment Index Report.” The full U.S. Bank Freight Payment Index is available at freight.usbank.com.
National freight market overview
The Q2 report shows that shippers paid significantly more to move freight, even as shipment volumes declined. At the same time, spending increased 6.4% from the prior quarter and 28.1% year over year, reflecting a market in which freight demand remains soft but available capacity has tightened.
National shipment volume decreased 1.1% from the first quarter of 2026, the second consecutive decline, for a combined two-quarter decrease of 1.4%. Compared to last year, volumes dipped 2.8%, reversing the first quarter’s 0.6% year-over-year gain, the first annual increase in four years.
Shipments remain soft because the broader freight economy remains soft. Federal Reserve factory output data for the first two months of the quarter suggested slightly more manufacturing freight, but the gain was narrow. Total factory output averaged 1.1% above first-quarter levels. Despite lower shipments, spending surged. The U.S. Bank National Spending Index rose 6.4% sequentially and 28.1% year over year. DAT data showed fuel at 75 cents per mile, 24 cents above the first quarter and nearly 80% higher year over year.
At the regional level, volumes were mixed again in the second quarter, reflecting uneven freight demand across the country, but spending trends were more consistent. Shipper spending rose in every region in Q2, except the Midwest, with the West recording the largest gain at 12%. Yet all regions saw substantial year-over-year spending increases. That divergence between mixed shipment activity and broad spending gains once again highlights the nationwide impact of tightening capacity.
Higher fuel surcharges added to shipper costs during the quarter, but fuel was not the only factor. In many markets, limited capacity appears to have been the larger factor. One favorable development for shippers was the late-quarter decline in diesel prices. After peaking above $5.64 per gallon in April, the national average diesel price ended the quarter nearly a dollar lower at $4.67 per gallon.
Freight spot, contract, and fuel rates
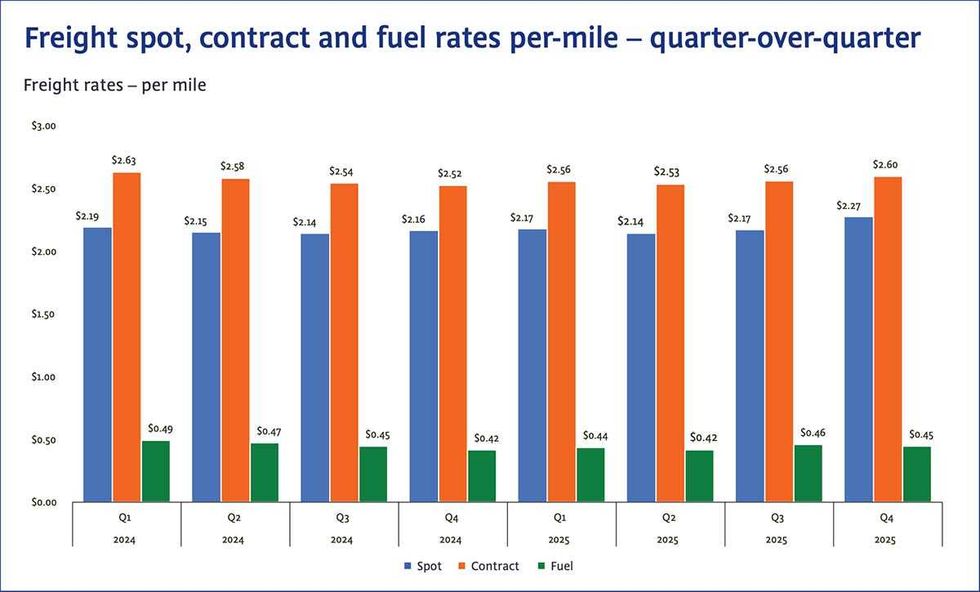
Average quarterly DAT spot rates rose 18.9% after an 11.9% gain in the first quarter, bringing the average fuel cost to $3.02 per mile. That’s 75 cents per mile above Q4 2025 rates and 88 cents per mile above year-earlier levels.
DAT also reported that contract rates increased in Q2, though by less than spot rates, narrowing the contract-spot spread. Like Q1’s report, this suggests some shippers may be leaning more on contract carriers to limit exposure after shifting more freight to the spot market as a cost-reduction strategy during the prolonged freight recession.
Fuel remained a meaningful cost driver. DAT estimated average fuel costs at 75 cents per mile in Q2, up 47.1% from Q1 and 78.6% from a year earlier. While fuel prices declined late in Q2, they remained well above year-earlier levels.
Regional shipments and spending
Most regions posted small shipment changes, with the Midwest the clear exception as volumes contracted 3.7%.However, two regions recorded higher shipments, two reported lower volumes, and one was unchanged from Q1. The Southwest posted the largest gain, though it was modest at 0.9%. While spending trends were more consistent, shipper spending increased sequentially in every region except the Midwest.
West regional shipments and spending
The West continued its moderate freight recovery after the sharp correction that followed the pandemic boom. Since bottoming in the first quarter of 2024, regional freight levels are up 8.5% and have declined sequentially in only two quarters. Compared to a year earlier, shipments rose 5.5%, the strongest gain among all five regions.
Several factors supported volume gains in the West region. Rebuilding after the early 2025 Los Angeles County wildfires continued to generate freight activity and caused housing starts to buck national trends. On a national level housing starts were down 4.5% over the same period last year, but West region housing starts were up 8.6% from the same period in 2025. Imports also helped, with the Port of Los Angeles reporting a 17% May increase from a year earlier. Inbound trucks from Mexico and Canada were generally stable. Consumer spending was mixed, with discretionary spending stable and non-discretionary spending lower. Shipper spending rose 12% sequentially and 35.9% year over year.
Southwest regional shipments and spending
Southwest freight activity showed the clearest gap between soft freight volumes and higher spending. During the first half of 2026, the Southwest Regional Shipments Index fell just over 10% from Q4 2025, while shipper spending increased by nearly 24%. While fuel surcharges contributed, tighter capacity appears to be the main factor.
It is important to note that industry participants have identified ELP (English Language Proficiency) enforcement and increased scrutiny of cross-border operating requirements, including cabotage involving Mexican B-1 drivers, as factors that may be influencing regional capacity availability. Given the Southwest’s role in cross-border freight, these developments may be more visible there.
Second-quarter shipments declined 0.6% sequentially and 20.2% year over year. Broader South housing starts fell 14.4% from the first quarter and 9.6% from 2025. Inbound trucks from Mexico were slightly above first-quarter averages. Dallas Fed contacts reported weaker retail sales tied to gasoline prices and low-income consumer pressure. Spending rose 11.2% sequentially and 39.9% year over year.
Midwest regional shipments and spending
The Midwest recorded the largest regional shipment decline, with volumes falling 3.7% from the first quarter. The drop followed strong gains in late 2025 and early 2026, when volumes increased a combined 9.1%. Compared with a year earlier, shipments were still up 2.8%, trailing only the West. First-half shipments increased 6.1% from the same period in 2025.
Manufacturing output was little changed, with growth primarily tied to data center products. Businesses remained cautious amid inflation and geopolitical uncertainty, limiting investment outside AI-related products. Consumer spending was split, with higher-income households spending at a good pace and lower-income households being more cautious. Housing starts rose 5.4% from the first quarter but fell 6.8% year over year.
Inbound trucks from Canada were slightly above first-quarter averages. Spending declined 0.8% sequentially in the region but remained 22.9% above a year earlier.
Northeast regional shipments and spending
The Northeast Regional Shipments Index was flat in Q2 after a 2.7% decline in the prior period. Despite recent softness, shipments were 2.0% higher than a year earlier and up 3.6% for the first half of 2026 compared with the same period in 2025.
FIFA World Cup preparation likely added modest freight as Boston, New York, and Philadelphia hosted June matches. Housing starts edged higher from the first quarter but were nearly 10% below year-earlier levels. Existing home sales softened in late April and most of May, which matters because home sales often trigger repairs, renovations, and appliance purchases. Manufacturing activity improved slightly and broadly matched national production trends. Consumer spending was mixed, with higher-income households spending broadly and lower-income households focused on essentials.
Spending increased 5.0% sequentially, the seventh straight increase, and was 26.5% above a year earlier.
Southeast regional shipments and spending
The Southeast posted its first sequential shipment gain in three quarters, with volumes rising 0.9%. That was the region’s largest increase in two years. Even so, freight remained 6.5% below a year earlier, and first-half volumes were down 6.8% from 2025.
Housing remained a headwind across the broader South, where starts declined 14.4% from the first-quarter average and 9.6% from a year earlier. Regional real estate activity was unchanged or lower in most markets, and tourism-related freight weakened.
Data center construction provided an offset, especially in Northern Virginia and Atlanta. Northern Virginia remains the world’s largest data center concentration, while Georgia ranks among the top five states for current and planned facilities. Atlanta Fed contacts also noted stronger premium-goods demand from higher-income consumers.
The Southeast Regional Spending Index rose 10% sequentially and 23.7% year over year.
