


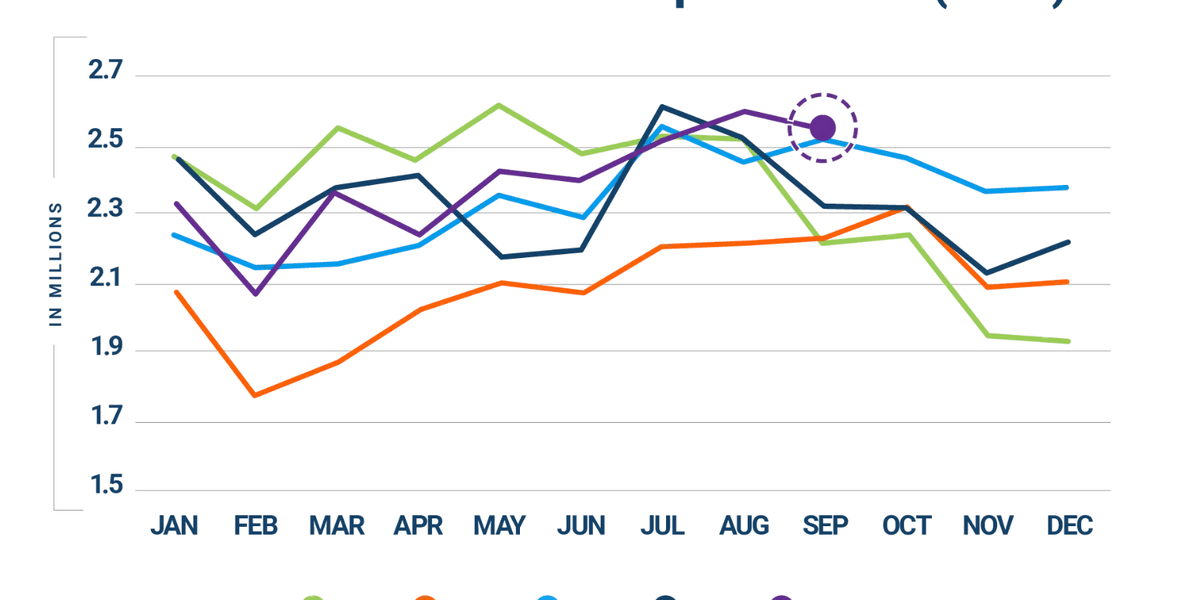
U.S. container imports reached their highest September volume on record, reaching 24.8% above the pre-Covid mark of September, 2019, according to the Global Shipping Report from supply chain software vendor Descartes.
By the numbers, September imports to the U.S. totaled 2,546,261 twenty-foot equivalent units (TEUs) in September 2026, down 2.2% from August and up 10.3% from September 2025.
The increase came despite stormy conditions in worldwide container flows. Descartes cited an array of changes to trade conditions, including: Middle East maritime incidents and new carrier fuel charges added to routing and cost risk; Section 232 tariff treatment for specified pharmaceuticals took effect for additional companies on September 29; the Panama Canal Authority announced a partial restoration of transit capacity; and some carriers are resuming selected Suez Canal services even as Red Sea security remains uncertain.
Much of the increase was driven by China-origin imports, the numbers showed. U.S. containerized imports from China reached 924,454 TEUs in September 2026, increasing 40,136 TEUs (4.5%) from August and 161,682 TEUs (21.2%) from September 2025 (see Figure 4). China represented 36.3% of total U.S. container imports, up from 34.0% in August.
China’s September import mix was led by plastics (HS-39), at 135,097 TEUs (14.6% of China-origin volume), followed by furniture and bedding (HS-94), at 123,574 TEUs (13.4%), and toys and sporting goods (HS-95), at 92,842 TEUs (about 10%). Machinery (HS-84) and electrical machinery (HS-85) accounted for a combined 17.6%, while apparel, made-up textiles, and footwear (HS-61 through HS-64) represented 11.1%.
The Descartes report also described the factors it is tracking as it seeks to manage supply chain risk in the months ahead:
- Middle East conflict and maritime security risk. Reports of continuing incidents in and around the Strait of Hormuz, while carrier surcharges show how fuel and insurance risks can affect freight costs and route choices.
- Expanded tariffs and other potential trade restrictions. In September, additional pharmaceutical-related Section 232 duties began for specified importers. Section 301 and other Section 232 measures remain relevant by origin and product.
- Port transit delays. If they decrease, it can indicate improved global supply chain efficiency or weaker demand for goods and logistics services. Delays increased at eight of the top 10 gateways in September, with the largest rise at New York/New Jersey. Monitor whether increases persist in October.
- Panama Canal availability. The Panama Port Authority plans to raise total reserved daily slots to 33 beginning October 15. Monitor whether the increase takes effect as announced, along with draft limits, reservations, and waits for unreserved ships.
- Red Sea routing. Some services have resumed Suez transits, but further disruption could restore Cape of Good Hope diversions and affect vessel capacity, transit times, and schedules.
- The economy. The U.S. remains an import-driven economy, so economic health is a key indicator of container demand. The Federal Reserve raised the federal funds target range to 3.75%–4.00% on September 16. The Bureau of Economic Analysis’ third estimate placed second-quarter real GDP growth at a 2.2% annualized rate, following a revised 2.5% in the first quarter. Consumer demand, inflation, energy costs, and interest-rate conditions remain important indicators for future import volumes.
