Support CleanTechnica’s work through a Substack subscription or on Stripe.
Or support our Kickstarter campaign!
Ontario Power Generation (OPG) has asked the Ontario Energy Board to approve a sharp increase in regulated nuclear payment amounts, including a year over year jump of more than 40% in 2027. The weighted average regulated payment amount rises from about $78/MWh in 2026 to roughly $110/MWh in 2027, driven by the nuclear payment amount increasing from around $111/MWh to about $207/MWh, almost doubling. For a typical household, this does not mean a 40% increase in the electricity bill. OPG’s own consumer impact analysis shows an increase of roughly $8 per month on a typical bill of about $142, or around 5.6%, mostly because a lot fewer MWh are being delivered at the much higher price. The difference between those two figures is the starting point for understanding what is happening and why it matters for affordability and system design.
An electricity bill is a bundle of charges layered together. Generation is only one part of what households pay. Transmission, local distribution, system operations, and regulatory charges make up a large share of the total. Nuclear sits inside the generation portion, and OPG’s regulated nuclear sits inside nuclear. When the regulated payment amount for OPG’s nuclear fleet rises sharply, the overall bill moves much less because the other layers do not change at the same rate. This does not make the nuclear increase less real. It means the effect is diluted across a broader bill structure.
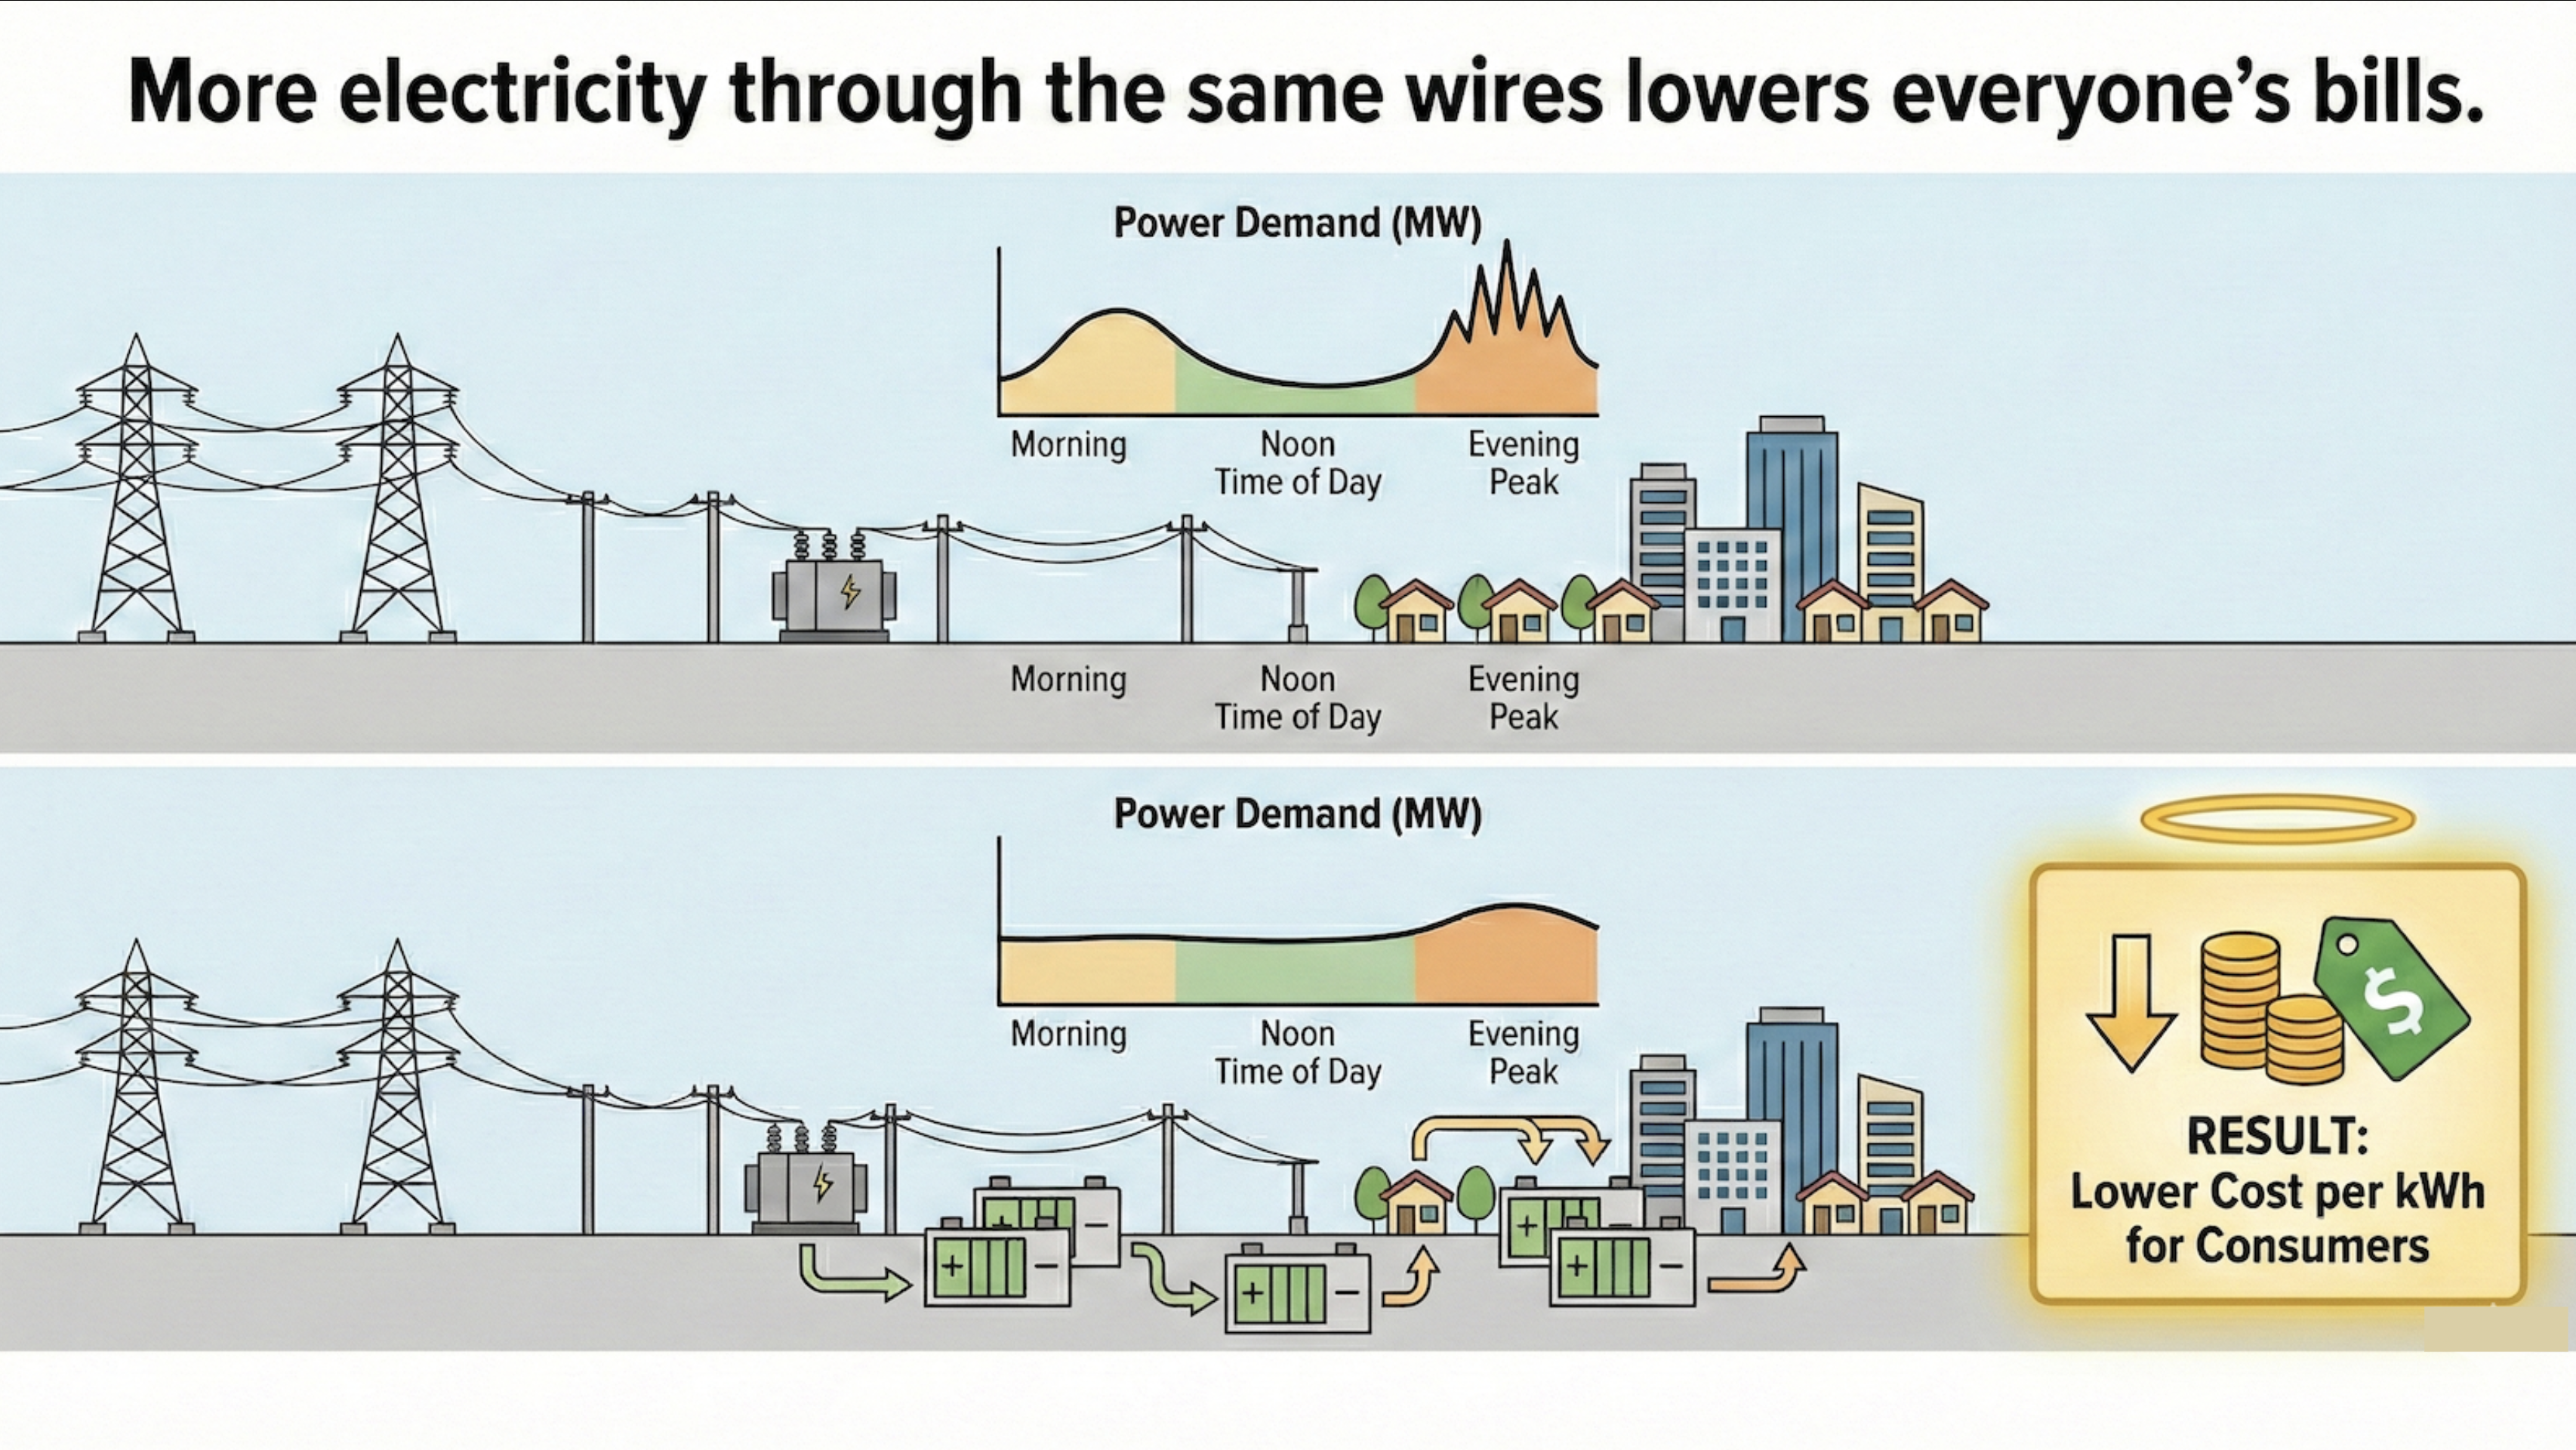
Importantly, the more Ontario is electrified with good demand management and batteries smoothing peaks, the more that the additional costs of transmission, local distribution, system operations, and regulatory charges are spread across more units of electricity, lowering their portion of the final bill. Expensive nuclear begins to dominate bills in that scenario causing higher rates than necessary, just as inexpensive renewables would lower rates.
Ontario’s nuclear system also has an important institutional split that needs to be clear early. There are two major nuclear operators. OPG is publicly owned and regulated on a cost of service basis. The other, Bruce Power, is privately owned and operates under a long term contractual structure with more exposure to performance and market discipline. The current rate application applies only to the public operator’s regulated nuclear fleet. System wide visuals and energy flows, however, reflect the combined output of both operators. Keeping that distinction clear avoids confusion when comparing rate case numbers to province wide generation totals.
What is increasing in this application is not spending that OPG failed to anticipate. It is the amount the regulator allows OPG to recover in a given year under cost of service regulation. The revenue requirement includes operating and maintenance costs, depreciation of capital already spent, return of capital, return on capital, taxes, and nuclear liability accruals. These costs were planned, forecast, and approved years ago. The regulatory question is not whether OPG expected them, but how and when they are recovered from ratepayers. A large increase in a payment amount can occur even when nothing unexpected has happened on the ground.
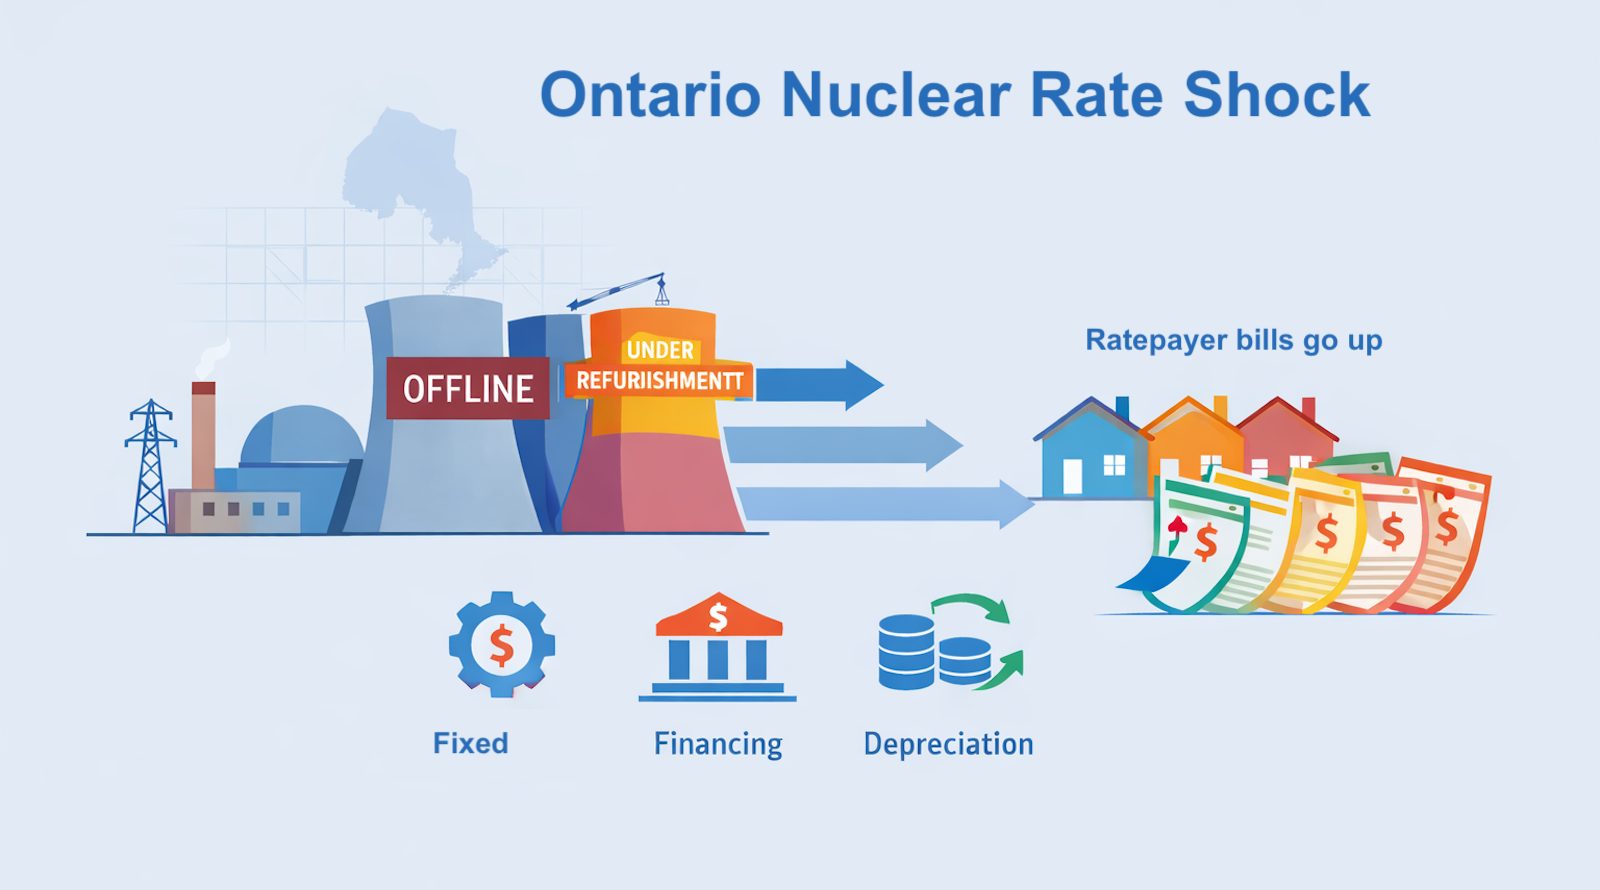
The key mechanical driver of the 2027 spike is a drop in output from OPG’s nuclear fleet, not a sudden surge in total nuclear spending. OPG’s filing shows production from its regulated nuclear facilities falling to roughly 18.7TWh in 2027, compared with values in the high 20s or low 30s TWh in surrounding years. This reflects planned refurbishment outages at Darlington combined with conservative assumptions about Pickering availability as those units operate under life extension conditions. Nuclear plants are expensive to own and relatively inexpensive to operate, while still having costs of operations above the cost of new wind and solar. When nuclear reactors are offline, most costs continue while output falls. Fixed costs are spread over fewer kWh under the regulatory structure, and the $/MWh figure rises quickly.
This is why outages matter so much in a nuclear heavy system. A large portion of Ontario’s electricity comes from a small number of very large units. When one or more of those units is offline, there are limited alternatives ready to scale up at the same cost. Gas generation can fill gaps, but that introduces fuel price exposure and emissions. Imports can help at the margin, but intertie capacity is finite. The result is that nuclear outages show up as price volatility even when total system costs remain within expected ranges.
Ontario’s electricity supply has become more reliant on natural gas than it was a decade ago, even though the province phased out coal years ago, almost entirely because the Ford Administration killed wind and solar development in the province as one of its first official acts, cutting up 758 contracts in 2018. In 2024, natural gas and other non-emitting sources accounted for about 16.6% of total generation in Ontario, equivalent to roughly 27.4TWh of electricity in a year where total generation was around 165 TWh.
This represents a material increase from earlier years when gas provided only single digit shares of generation, reflecting a shift to gas for flexibility and reliability as nuclear units undergo refurbishment and as growth in demand outpaces non-emitting capacity additions. Natural gas plants play a key role on hot summer and cold winter days when demand peaks, especially in the absence of grid battery storage, but their rising share has also increased the system’s overall carbon intensity and exposure to volatile fuel prices.
According to supply plans in the province’s Integrated Energy Plan and independent forecasts, natural gas generation is expected to continue to contribute meaningfully to the supply mix in the coming decade, particularly as the Independent Electricity System Operator forecasts strong electricity demand growth through 2030 and beyond that will require dispatchable capacity. This trend is important because while natural gas provides valuable operational flexibility, it also introduces fuel cost risk and greenhouse gas emissions that must be weighed alongside the long-term affordability and carbon goals of the grid.
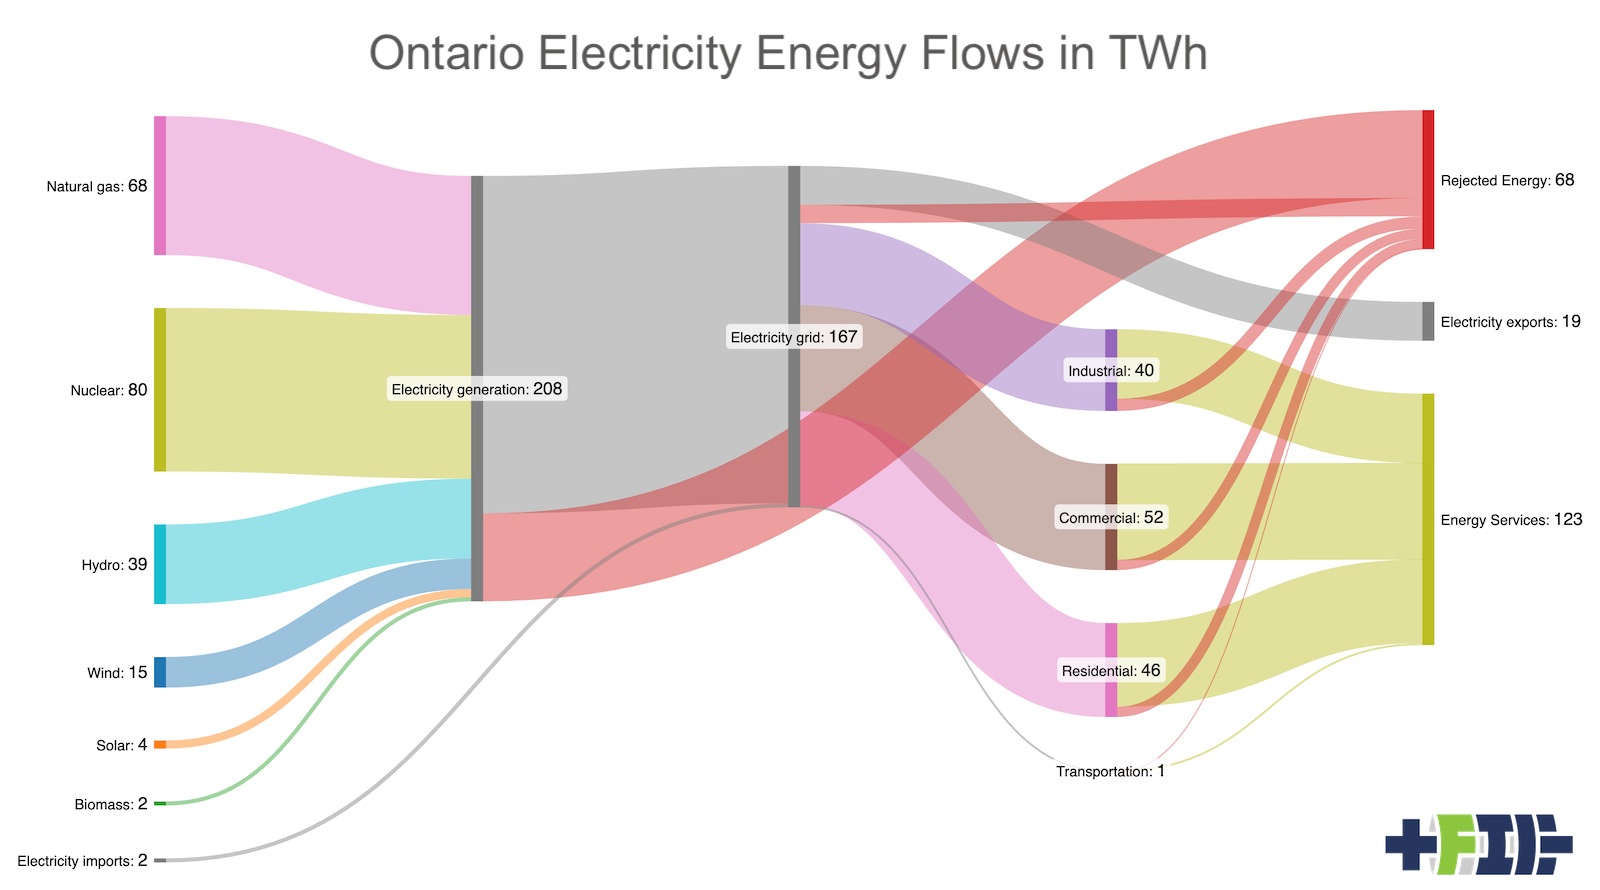
When Ontario’s electricity flows are laid out in a Sankey diagram that includes both operators, the structure becomes clear. Nuclear dominates supply in a normal year. Hydro is significant but smaller. Wind and solar are thinner flows. Storage and imports are narrow. Even though the rate spike comes from OPG’s fleet, the system impact is shaped by how nuclear dominates electricity overall. When the largest flow narrows during outages, there are not many other flows ready to widen except for natural gas. Note that for this view, I chose to express only the net electricity that nuclear generates as the primary energy input, not the much larger amount of energy produced before inefficient thermal generation. Rejected energy would be roughly three times higher to reflect the portion of the 242 TWh of thermal energy that nuclear creates in order to create 80 TWh of electricity.
Inflexibility is the hidden cost of too much nuclear. Nuclear reactors are designed to run at steady output. They do not ramp easily and require long outages for refurbishment and maintenance. These traits are manageable when nuclear provides a bounded share of supply. They become costly when nuclear dominates the system. Once nuclear rises above what I estimate to be roughly 40% of electricity supply, the system begins to overbuild inflexible capacity. That leads to curtailment of renewables in some hours, higher balancing costs in others, payments to neighboring jurisdictions to take excess electricity, and sharper price swings during outages. It also led to the only positive outcome of too much nuclear, which is the very cheap overnight rates available to electric car owners among others.
A 40% upper bound is not a technical cliff. It is a practical design guideline drawn from system behavior. Below this level, nuclear provides firm low carbon supply that supports reliability. Above it, inflexible capacity starts to crowd out options and raise costs. Ontario has been above this range for years, which is part of the reason why additional nuclear capacity will worsen rather than improving it. Note that this isn’t an argument that some nuclear on a grid is necessary for reliable generation, quite the opposite. Building nuclear instead of renewables at any scale diverts regulatory, construction and capital resources that could have accelerated deployment wind, solar and batteries. Renewables heavy grids like Denmark’s and Germany’s are among the most reliable in the world, with 13 minutes of outages per customer per year on average, compared to the United States’ 5.5 to 11 hours per year in recent years. It’s an argument that it doesn’t cause as significant grid management problems below that level, it’s just expensive complexity.
Wind and solar have a different cost profile. Like nuclear, they are capital intensive upfront, but their operating costs are much lower and more predictable. Once built, they push electricity into the system at very low marginal cost for decades. Adding renewables reduces the share of electricity that must recover large fixed costs during outage years. Over time, this lowers average electricity prices, not just volatility. This effect is visible in many jurisdictions where large additions of wind and solar have coincided with declining wholesale prices even as demand has grown.
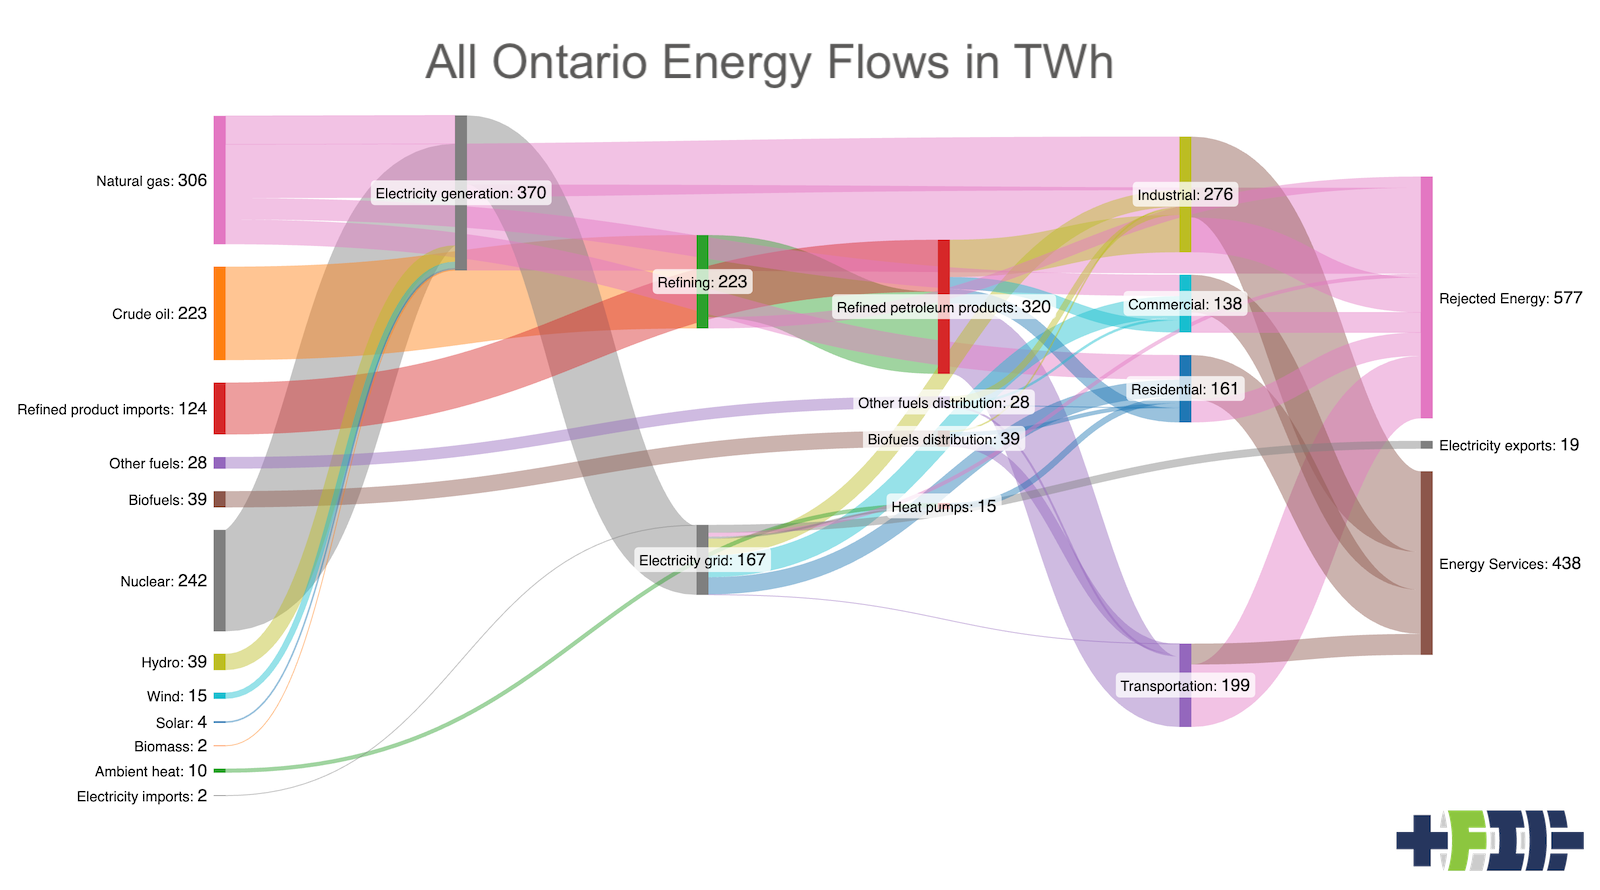
The affordability story becomes clearer when shifting from electricity to total energy. Electricity is only a portion of how Ontarians use energy. Transport fuels and heating fuels still dominate household and business energy spending. A total energy Sankey shows electricity as a smaller slice than many people expect, with nuclear sitting entirely within that slice. Expanding nuclear affects only this portion of the energy system.
Note that for this view, I chose to represent the full thermal energy generated by nuclear of 242 TWh and the rejected energy flowing out of it as LLNL does for their energy Sankeys for the USA. Both are defensible perspectives for nuclear as so little of the ‘fuel’ is consumed per MWh, unlike fossil fuels, but the earlier Sankey more accurately reflected the mix of electricity in the system, with only natural gas generation having rejected energy. Ontario’s rejected energy is 59% of total energy input to the economy in this view.
Electricity is already the cheapest energy carrier per unit of useful work. Electric vehicles convert energy to motion three to four times more efficiently than internal combustion engines. Heat pumps deliver several kWh of heat for each kWh of electricity. As transport and heating electrify, households spend less on energy overall even if electricity consumption rises. The condition for those savings is that electricity prices remain stable or fall over time, which is where renewables matter most.
This is where opportunity cost enters the picture. Heavy investment in new nuclear absorbs capital, policy attention, and grid capacity that could otherwise accelerate renewables, storage, and electrification. The cost of delay is not abstract. It shows up as higher household energy spending for longer, as gasoline, diesel, and natural gas remain in use.
The decision to pursue small modular reactors adds another layer to this picture. The SMRs at Darlington are being developed by the publicly owned utility, OPG, under a cost of service framework. Development and early construction costs are already flowing into the nuclear revenue requirement, even though the units won’t be producing electricity for years, likely many more years than the current schedule projection. Ratepayers are paying financing and development costs today, with much larger construction and depreciation costs to come later in the decade.
The contrast with the private nuclear operator, Bruce Power, is instructive. The private operator has chosen to focus on refurbishing existing large reactors rather than building SMRs. That choice reflects exposure to cost, schedule, and performance risk. First of a kind nuclear projects have long lead times, uncertain costs, and limited flexibility. In addition to first of a kind risks, the SMR reactor designs, operations and fuel cycle are completely familiar to Ontario’s nuclear operators. Ontario has no nuclear reactor construction experience left, as the last reactor was turned on a generation ago, so there are no master builders and experienced teams. Ontario knows how to run existing nuclear and occasionally refurbish the CANDU fleet, but that’s it. Without guaranteed cost recovery, private capital won’t proceed under those realities. In Ontario, the reason SMRs are moving forward is that risk can be socialized to Ontarians through regulation and the current Administration refuses to accept the global lessons on renewables, not that SMRs are the lowest cost or most flexible option.
This distinction matters for rates. When SMR costs rise above current projections, and they will, those overruns will flow into rate base if deemed “prudent” by the regulators. That increases depreciation, return of capital, and return on capital for decades, and Ontario ratepayers or taxpayers will be paying those costs. Overruns also raise financing costs during construction, which affects rates before any electricity is delivered. If delays accompany overruns, fixed costs are spread over fewer kWh for longer, worsening the same denominator problem seen in the 2027 refurbishment year, but stretched across many years.
It’s worth pointing out that Ontario still carries the legacy financial burden of the massive nuclear build-out undertaken by Ontario Hydro in the 1970s and 1980s, and that burden has persisted for decades. When Ontario Hydro was reorganized in 1999, its assets were valued at roughly $39.6 billion while its long-term debt was about $26.2 billion, with a large portion of that debt tied directly to nuclear construction, cost overruns, and related liabilities.
Much of that stranded debt was transferred to the Ontario Electrical Financial Corporation to manage and service, rather than being absorbed by investors, and it has been paid down only gradually over the years. As of 2024, that successor entity still carried about $12.1 billion in debt originally associated with the old nuclear program, and it was paying roughly $626 million in interest charges in that year alone. That debt does not mature until 2050, which means Ontario taxpayers and ratepayers will continue servicing obligations from past nuclear build projects well into the middle of this century. Current discussions about new, expensive and untried SMRs should be occurring in context of that still very high debt that Ontario taxpayers and ratepayers are funding.
It is also important to separate refurbishment from new nuclear. Refurbishment creates short term price volatility because of outages, but the assets already exist and return to service, assuming refurbishment goes well. New nuclear creates long term cost commitments. In OPG’s own filings, the Darlington New Nuclear Program already accounts for hundreds of millions of dollars per year in revenue requirement. By the end of the decade, new nuclear is likely to represent roughly one quarter to one third of the incremental increase in nuclear costs. These commitments are locked in early and recovered over decades. Extending the life of nuclear reactors instead of more aggressively ramping up wind and solar is a trade off, and at present Ontario is making the decision to refurbish very old reactors, with the intent of running them to ages no nuclear reactor in the world has ever seen. This doesn’t mean geriatric nuclear reactors will necessarily be unsafe, but they get increasingly expensive to maintain, operate and refurbish.
The timing of this discussion matters because Ontario is encouraging households and businesses to electrify vehicles and heating at the same time these nuclear costs are rising. If electricity becomes more expensive during that transition, the economics of electrification weaken. Households still save on fuel, but the savings shrink. Public confidence erodes, and pressure builds to slow electrification or subsidize electricity, shifting costs rather than reducing them.
A cheaper and more resilient system looks different. Under this model, nuclear’s percentage of total electrical generation drops to 16% and it stops being a problematically inflexible major source of generation. Most new generation comes from renewables with low operating costs. Storage and demand response smooth variability. Transmission grows as neighboring jurisdictions assist each other to balance renewables, storage and demand. Electrification reduces total energy demand and shifts spending from volatile fuels to stable electricity. This combination lowers average costs and reduces exposure to outages and fuel price swings.
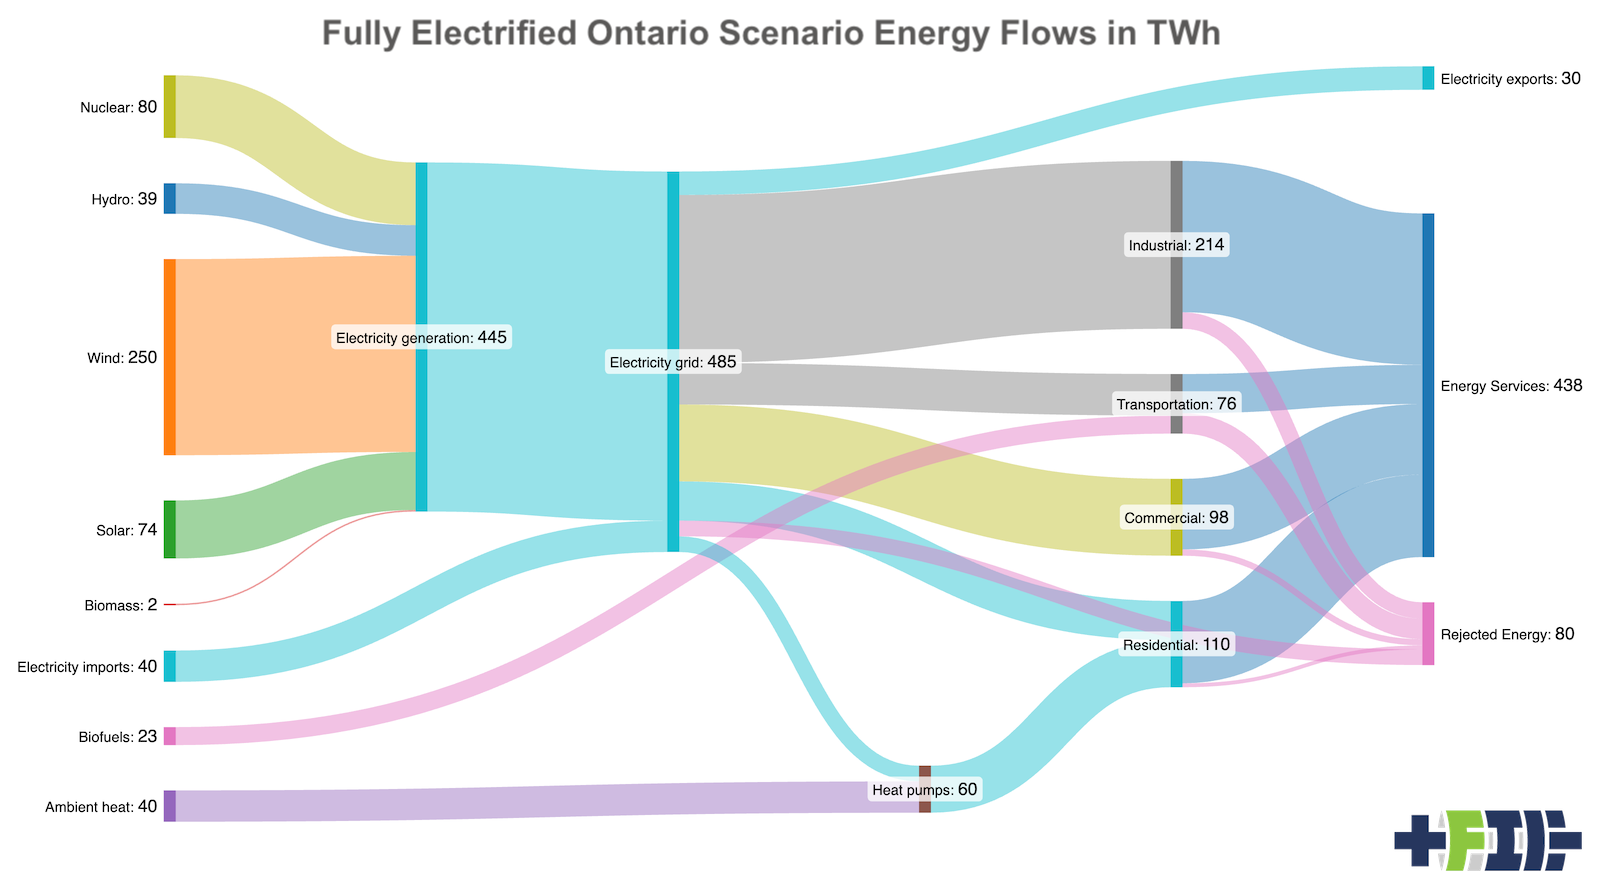
This scenario is a deliberately simplified “physics-first” projection of an almost fully electrified Ontario economy. It holds total useful Energy Services constant at 438 TWh, matching the earlier baseline, and asks what primary energy would be required if combustion is largely eliminated. Timing, capital stock turnover, and political constraints are set aside in favor of technical plausibility. All incremental primary energy required for electrification is supplied by a mix of wind, solar, expanded cross-border electricity trade, and ambient heat captured via heat pumps.
Electrification assumptions follow well-established efficiency gains. Industrial, commercial, and residential energy services are assumed to shift entirely to electricity and heat pumps, reducing end-use rejected energy relative to combustion. Ground transportation and all inland marine transport are fully electrified, while aviation is split: sub-1,000 km flights—all those within the Golden Horseshoe—are assumed to transition to hybrid-electric turboprops, and longer-haul flights are supplied by biofuels, which are retained as a limited non-electric primary energy input. Oil refining and petroleum flows are removed entirely from the energy system, as crude oil is treated as a non-energy feedstock for chemicals and materials. Cross-border transmission is expanded substantially to allow balancing with neighboring hydro- and wind-rich jurisdictions, reducing the need for overbuilding domestic firm capacity. These assumptions are strongly in line with those that we agreed upon in Netherlands transmission systems operators TenneT during workshops to create a pragmatic 2050 decarbonized energy scenario for the country last year. For perspective, the Netherlands is slightly larger than the Greater Golden Horseshoe, has 2 million more residents than Ontario and a slightly higher GDP.
A sense check against Ontario’s physical resource base makes it clear that the resulting wind and solar build-out is well within plausibility. Ontario has over 1 million square kilometers of land and water, strong onshore and offshore wind resources (especially along the Great Lakes), and solar insolation comparable to Germany, which already operates at far higher solar penetration.
Even several hundred terawatt-hours per year of combined wind and solar generation would require only a small fraction of provincial land area and would be complemented by imports, hydro flexibility, and demand-side efficiency gains. The result is a coherent, internally balanced energy system that delivers the same societal services with far lower primary energy demand and dramatically reduced rejected energy. For this view I chose to return to only the TWh of electricity contributions of nuclear to show it against wind, solar and hydro on an apples to apples basis.
The current nuclear rate filing is not only about paying for reactors. It is a signal about system design and risk allocation. Ontario can continue to benefit from its nuclear fleet while recognizing that too much nuclear raises costs and reduces flexibility. Keeping nuclear around it’s current capacity and accelerating renewables and electrification offers a clearer path to lower household energy costs and a more stable energy system over time.
Support CleanTechnica via Kickstarter

Sign up for CleanTechnica’s Weekly Substack for Zach and Scott’s in-depth analyses and high level summaries, sign up for our daily newsletter, and follow us on Google News!
Have a tip for CleanTechnica? Want to advertise? Want to suggest a guest for our CleanTech Talk podcast? Contact us here.
Sign up for our daily newsletter for 15 new cleantech stories a day. Or sign up for our weekly one on top stories of the week if daily is too frequent.
CleanTechnica uses affiliate links. See our policy here.
CleanTechnica’s Comment Policy